
Page 70 - Micro5 Brochure 2017
P. 70
516 J. Phys. Ther. Sci. Vol. 23, No. 3, 2011
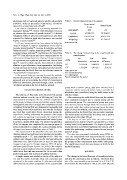
advantages such as increased sensory comfort and excellent Table 1. General characteristics of the subjects
stability, with no muscular contraction, electrical
discomfort, or significant side effects8). Experimental Control Group
Group
Low electric stimulation is a promising approach for
angiogenic therapy9,10). Electric field stimulation is known Gender(M/F) 4/12 7/6
to enhance the secretion of growth factors11). A distinct
therapeutic effect of ultra-low microcurrent has also been Age(yr) 67.88±7.99 70.38±4.35
reported for diabetes, high blood pressure, and wound
healing in recent reports12). Height(cm) 159.56±7.16 162.15±5.51
In Korea, microcurrent has been shown to delay the Weight(kg) 59.13±8.52 63.77±9.17
onset of myalgia13), improve sympathetic nerve tone14),
promote wound healing15), increase β-endorphin and pain Values are M±SD
threshold levels16), repress bacterial growth17), reduce foot
muscular fatigue and pain18), and increase the blood flow Table 2. The change of blood flow in the experimental and
rate19,20). Pain alleviation and tissue changes induced by control groups
microcurrent therapy have been observed during treatment
of myofascial pain syndrome patients with chronic back group Pre- Post- Mean
pain21). Based on these reports, microcurrent is clearly
effective in pain alleviation, tissue regeneration, facilitating intervention intervention difference
wound and fracture healing, repressing bacterial growth,
and improving the blood flow rate by relieving tension in EG 2.21±1.50 3.40±2.31 1.19±2.11*
the sympathetic nervous system.
CG 3.51±2.98 4.03±2.13 .52±2.32
In the present study, our aim was to search for methods
that would promote the health of diabetes patients. Our Values are M±SE
approach was to investigate the effect of microcurrent EG : experimental group
electrical stimulation, provided through a shoe, on blood CG : control group
circulation and pain in the feet of diabetes patients. *p<0.05 compared to the control
SUBJECTS AND METHODS group with a control group, data were entered into a
computer and the measured values before and after the
The subjects of this study were selected from among stimulation were normalized, using the stable values as the
diabetes patients over the age of 60 living in P city. The reference values.
study included 32 subjects who were without complications
of the heart, kidneys, nerves, and retinas, whose fasting After measuring the stable blood flow rate, the subjects
blood glucose was over 120 mg/l, who complained of pain were randomly arranged into a control group and the
or tingling of the feet that was diagnosed as neuropathy and experimental group. The experimental group was given
were being treated with medicines, and who did not ingest shoes (G-man, Korea) through which the microcurrent was
any food that could affect blood circulation during the delivered, while the control group was given the same
experiment. Having understood the purpose of the study shape of shoes but without microcurrent. After one hour of
and voluntarily agreeing to participate, the subjects were walking exercise, the blood flow rate was again measured.
randomly arranged into an experimental and control group The microcurrent delivered by the shoes was a pulsed
to perform a double blind study. The general characteristics microcurrent of less than 300 μA.
of the 29 subjects who completed the exercise program (3
subjects who failed to continue the exercise program during The degree of foot pain after the microcurrent
the experiment were excluded) are given in Table 1. application to the diabetic subjects was assessed by a Visual
Analog Scale (VAS) questionnaire. The degree of pain was
The measurement of the blood flow rate in the feet of the measured twice once before beginning the exercise and 4
diabetes patients was performed at a laboratory temperature weeks after performing a walking exercise for one hour per
maintained at 24 ± 1 and a humidity of 50 ± 10%. The day for 4 weeks.
subjects were allowed to take a rest for one hour before the
laboratory test. Blood flow rate in the feet was then The data were processed statistically using SPSS ver.
measured using the Biopac System MP150 pulse 12.0. The independent t-test was performed to verify the
plethysmogram (Biopac System, Inc., USA). The subjects significance of the differences in the mean values between
assumed a supine position before the measurement and the the groups and the measurement items within each group.
stable blood flow rate was measured for 30 seconds in that The significance level (α) was chosen as 0.05 for the
position and again after one hour of walking exercise. statistical analysis.
A simple sensor was attached to the tip of the subject’s RESULTS
toe and the stable real-time flow rate variation was
monitored in the supine position. To eliminate individual The change in the blood flow rate of the subjects before
differences and to allow comparison of the experimental and after the intervention was as follows. The blood flow
rate of the experimental group increased from 2.21 ± 1.50
mv/V before the intervention to 3.40 ± 2.31 mv/V after the