
Page 58 - Micro5 Brochure 2017
P. 58
Effect of microcurrent electrical stimulation on tendon healing 113
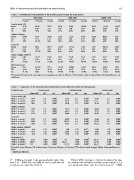
Table 2 Biomechanical measurements of the studied groups through the study period.
Third week Fifth week Eighth week
Control Cathodal Anodal Control Cathodal Anodal Control Cathodal Anodal
Load at break (N)
Mean 56.18 84.28 78.27 66.32 95.44 103.09 86.33 131.53 141.37
4.44 5.25 5.09 7.84 7.02 5.05 10.08 6.38
SD 5.22 39% 36% 31% 44% 48% 40% 61% 67%
% 26%
Stiffness (N/mm)
Mean 22.44 35.91 32.98 35.01 53.63 59.05 58.24 80.03 85.75
1.17 1.31 2.86 2.81 2.19 6.06 4.241 2.80
SD 1.37 28.7% 26% 28% 43% 47% 40% 64% 68%
% 18%
UTS (N) 68.26 98.61 90.97 122.19 141.16 150.3 159.1 206.37 218.9
Mean 3.76 5.78 4.74 8.54 4.93 9.14 7.60 10.37 8.22
SD 23% 32.7% 30% 41% 47% 50% 53% 68% 73%
%
Elastic modulus (N/mm2)
Mean 8.00 17.29 12.86 14.14 22.29 26.71 22.71 42.14 47.29
2.36 1.86 4.63 4.23 2.13 3.45 5.39 4.42
SD 1.91 31.5% 23.4% 25.7% 40.6% 48.7% 41.4% 76.8% 86.2%
% 14.5%
Work done (mJ)
Mean 450 833.00 757.5 511.70 948.00 1103.2 658.7 1099.5 1270
56.72 52.47 61.64 66.67 52.87 81.52 85.38 49.38
SD 54.91 40% 36.1% 24.4% 45.2% 52.7% 31.4% 52.5% 60.6%
% 21.5%
SD: standard deviation, %: percentage to corresponding normal, N: Newton, UTS: ultimate tensile strength, N/mm: Newton/millimeter, mJ:
milli Joule
Table 3 Comparison of the biomechanical measurements across study time within the study groups.
Treatment time Control group Cathodal group Anodal group
Mean Diff. SE Sig. Mean Diff. SE Sig. Mean Diff. SE Sig.
Load at break (N) 10.14 2.9 0.000* 11.16 2.9 0.000* 24.28 2.9 0.000*
Week 3 vs week 5 30.15 2.9 0.000* 47.25 2.9 0.000* 63.1 2.9 0.000*
Week 3 vs week 8 20.01 2.9 0.000* 36.09 2.9 0.000* 38.28 2.9 0.000*
Week 5 vs week 8
Stiffness (N/mm) 12.57 1.4 0.000* 17.72 1.4 0.000* 26.07 1.4 0.000*
Week 3 vs week 5 33.8 1.4 0.000* 44.12 1.4 0.000* 52.77 1.4 0.000*
Week 3 vs week 8 23.23 1.4 0.000* 26.40 1.4 0.000* 20.98 1.4 0.000*
Week 5 vs week 8
UTS (N) 53.93 3.2 0.000* 42.09 3.2 0.000* 59.40 3.2 0.000*
Week 3 vs week 5 90.89 3.2 0.000* 107.76 3.2 0.000*
Week 3 vs week 8 36.96 3.2 0.000* 65.21 3.2 0.000* 127.25 3.2 0.000*
Week 5 vs week 8
1.93 0.002* 5.00 3.2 0.000* 68.55 1.93 0.000*
1.93 0.000* 24.86 1.93 0.000*
Elastic modulus (N/mm2) 1.93 0.000* 19.86 1.93 0.000*
Week 3 vs week 5 6.14 1.93 0.01* 13.86
Week 3 vs week 8 14.71 1.93 0.000* 34.43
Week 5 vs week 8 8.57 1.93 0.000* 20.57
Work done (J) 61.71 6.005 0.000* 115 6.005 0.000* 345.71 6.005 0.000*
Week 3 vs week 5 208.71 6.005 0.000* 266,57 6.005 0.000* 512.43 6.005 0.000*
Week 3 vs week 8 147 6.005 0.000* 6.005 0.000* 166.71 6.005 0.000*
Week 5 vs week 8 151.57
Mean diff: mean difference, SE: standard error of the mean difference, N: Newton, UTS: ultimate tensile strength, N/mm: Newton/millimeter, J:
Joule.
* Significant difference.
(P = 0.000), and at week 5 also was significantly higher than Effect of MES: As shown in Table 4, the values of the elas-
week 3 (P = 0.002, 0.01, and 0.000 for control, cathodal and tic modulus of the cathodal and anodal groups at weeks 3, 5, 8
anodal groups respectively (Table 3). were significantly higher than the control group (P = 0.000)