
Page 59 - Micro5 Brochure 2017
P. 59
114 A.F. Ahmed et al.
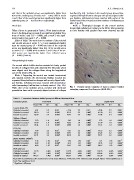
bundles (Fig. 4B). Tendons in the anodal group showed less-
and that of the cathodal group was significantly higher than organized fibroploriferative changes with poorly aligned colla-
that of the anodal group at weeks 3 (P = 0.02) while at weeks gen bundles, Inflammatory tissue reaction with notice of the
5 and 8 that of the anodal group were significantly higher than newly formed blood vessels and few numbers of inflammatory
cathodal group (P = 0.02 and 0.01 respectively). cells. (Fig. 4C).
Work done Week 5: Histological changes of the control tendons
showed high cellularity in relation to the fibrils. Many attempts
Effect of time: As presented in Table 3, Work done by the ten- to form bundles with parallel fibers were observed but still
dons in the three groups at week 8 was significantly higher than
those of weeks 3 and 5 (P = 0.000), and at week 5 was signif- Fig. 3 Normal tendon consisting of mature compact bundles
icantly higher than week 3 (P = 0.000). entangling compressed few fibrocytes (H&E 400·).
Effect of MES: The work done by tendons of the cathodal
and anodal groups at weeks 3, 5, 8 were significantly higher
than the control group (P = 0.000) and that of the cathodal
group was significantly higher than that of the anodal group
at weeks 3 (P = 0.000) while at weeks 5 and 8 that of the an-
odal group was significantly higher than cathodal group
(P = 0.000) (Table 4).
Histopathological results
The normal rabbit Achilles tendon consisted of closely packed
bundles of collagen fibers with relatively few fibrocytes which
were aligned with the collagen fibers along the longitudinal
axis of the tendon (Fig. 3).
Week 3: Regarding the control non treated tenotomized
and repaired tendons, the microscopic findings revealed less
organized fibroploriferative changes with poorly aligned colla-
gen bundles. Inflammatory tissue reaction with mononuclear
cells (macrophage) infiltrations is clearly noticed. (Fig. 4A).
While that of the cathodal group, revealed well developed
granulation tissue with a properly aligned pattern of collagen
Table 4 Comparison between studied groups at different treatment time.
Compared groups Third week Fifth week Eighth week
Mean Diff. SE Sig. Mean Diff. SE Sig. Mean Diff. SE Sig.
Load at break (N) 6.01 2.9 0.04* À7.56 2.9 0.01* À9.84 2.9 0.001*
Cathodal vs anodal 28.10 2.9 0.000*
Cathodal vs control 22.09 2.9 0.000* 29.12 2.9 0.000* 45.20 2.9 0.000*
Anodal vs control
2.9 0.000* 36.77 2.9 0.000* 55.04
Stiffness (N/mm) 2.93 1.4 0.04* À5.42 1.4 0.000* À5.72 1.4 0.000*
Cathodal vs anodal 13.47 1.4 0.000*
Cathodal vs control 10.54 1.4 0.000* 18.62 1.4 0.000* 21.79 1.4 0.000*
Anodal vs control
1.4 0.000* 24.04 1.4 0.000* 27.51
UTS (N) 7.64 3.2 0.02* À9.21 3.2 0.006* À12.55 3.2 0.000*
Cathodal vs anodal 30.35 3.2 0.000* 18.97 3.2 0.000*
Cathodal vs control 22.71 3.2 0.000* 28.18 3.2 0.000* 47.22 3.2 0.000*
Anodal vs control
1.93 0.02* À4.43 3.2 0.000* 59.77 1.93 0.01*
1.93 0.000* 8.14 1.93 0.000*
Elastic modulus (N/mm2) 4.43 1.93 0.02* 12.57 1.93 0.02* À5.14 1.93 0.000*
Cathodal vs anodal 9.29 1.93 0.000* 19.43
Cathodal vs control 4.86 1.93 0.000* 24.57
Anodal vs control
Work done (J) 75.43 6.005 0.000* À155.29 6.005 0.000* À170.43 6.005 0.000*
Cathodal vs anodal 383 6.005 0.000* 436.29 6.005 0.000* 440.86 6.005 0.000*
Cathodal vs control 307.57 6.005 0.000* 591.57 6.005 0.000* 611.29 6.005 0.000*
Anodal vs control
Mean diff: mean difference, SE: standard error of the mean difference, N: Newton, UTS: ultimate tensile strength, N/mm: Newton/millimeter, J:
Joule, Sig. significance level.
* Significant difference.